
Report
One Screen. All Your Numbers. No More Guessing.
Most companies have their data scattered across five different tools, and nobody has time to check them all.
Report
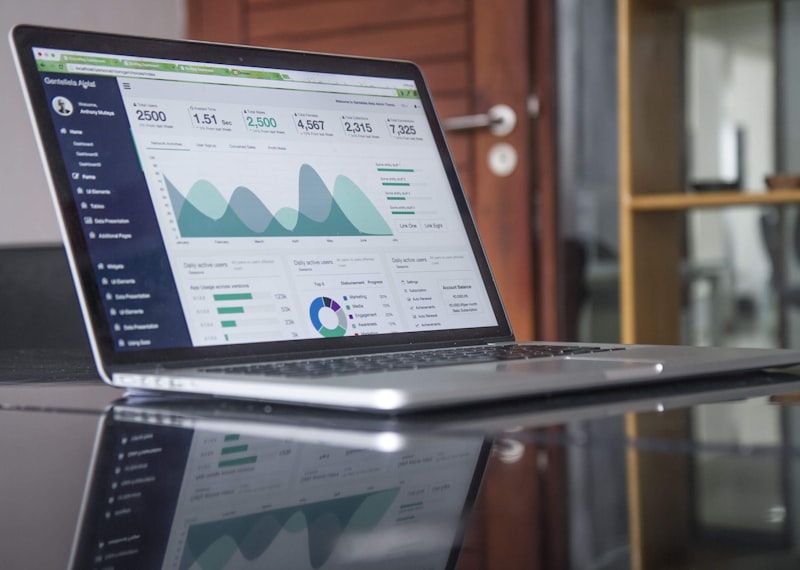
We build dashboards that pull everything into one place, update themselves, and explain what's actually going on, not just what the numbers say.
What we offer with Reports?
- Custom dashboard design, built around your business
- Google Analytics integration
- Search Console integration
- Sales data integration
- KPI panels
- Weekly and monthly automatic reports
- AI-powered performance commentary, in plain language
- Executive summary reports for quick decisions
Tools we use for Reporting


Why Reporting Matters?
- All your data, visible on one screen
- Way less time spent building manual reports
- Faster, more confident decision-making
- Continuous performance tracking, not just a monthly snapshot
- More time doing the work, less time reporting on it
FAQs
Still have Qs?
Find answers to common questions about reporting, dashboards and analytics.
It helps, but it's not a dealbreaker. If they're not set up yet, we'll take care of that as part of the process.
Yes. We regularly connect ad platforms, CRM data and sales figures alongside your SEO and analytics data, so you get the full picture in one place.
Automatically, in real time or daily depending on the data source, no one on your team needs to click "refresh" or export anything manually.
Absolutely, and we can set different views for different people, so your marketing team and your leadership team each see what's relevant to them.
No problem, dashboards aren't set in stone. We can add, remove or adjust what's tracked as your priorities shift.
No, just a browser. Everything lives in tools like Looker Studio or Power BI, accessible from a link.
Curious where you actually stand? Let's take a look together.
Tell us what’s eating your team’s time, and we’ll show you what can be automated.